👨🏻💻 Cybersecurity
Blue Team: SysAdmin
Blue Team
Blue Team: SysAdmin
Blue Team work is defensive system administration:
- Reduce the paths an attacker can use.
- Make compromise harder to achieve.
- Detect suspicious activity early.
- Preserve evidence when something happens.
Note
The attacker only needs one working path. The defender has to remove, monitor, or contain as many paths as possible.
Sections that we’ll see
| Phase | Question | Course block |
|---|---|---|
| Harden | What can we remove or restrict before an attack (S.O related)? | Linux hardening |
| Monitor | What is happening now? | Grafana, Prometheus, Loki |
| Detect | Which activity looks malicious? | IDS |
| Deceive | Can we make attacks observable? | Honeypots |
| Maintain | Could there be an exploitable vulnerability in our app that isn’t directly related to our code? | Best practices for our app’s |
| Recover | If we’ve an attack, what happened? | Forensics |
Sections we won’t cover
- Network security in depth (VLANs, MAC address restrictions, VPNs, advanced firewall configuration, etc.)
- Account and authentication security (passkeys, 2FA, hardware security keys, Kerberos, etc.)
- Monitoring, analyzing, and automatically updating other devices (printers, IoT devices, etc.)
- Cloud architecture in depth, including advanced analysis and security considerations
- Malicious traffic targeting our application (bot detection, DDoS detection and mitigation, etc.)
Threat model
To decide which OPSEC practices to adopt, you first need to understand what you’re defending against. A health app storing sensitive user data, a rock-paper-scissors app, and your own personal server all face very different risks, and therefore have very different threat models.
A threat model is a description of your adversaries with:
- their goals
- capabilities
- targets
The more powerful and well-funded the adversary, the more dangerous it is (States being at the top of the food chain).
Note
Think carefully about whether you really need to apply every measure we cover here. Security always involves trade-offs, so weigh the time and effort each measure requires against the actual protection it gives you.
Hardening
How can we make it more difficult for an attacker to compromise our operating system?
Hardening Is attack Surface Reduction
The Linux hardening guide used for this section defines a core idea, BUT:
- Do not apply a checklist blindly.
- Decide what matters for YOUR threat model.
- Understand that security changes can reduce usability or compatibility.
Source: https://madaidans-insecurities.github.io/guides/linux-hardening.html
Linux Is Not Automatically Secure
- It is open source.
- It is popular on servers.
- It has a smaller desktop user base.
- It includes security features that are often misunderstood.
Note
BUT: defensive configuration matters, and it is typically not included out of the box because the distribution usually has no way of knowing your specific threat model.
Choosing the right Linux distribution
- Ubuntu: Release each 6 months. Back support: 2 distributions, LTS Release each 2 years. Support for 5 years.
- Fedora: Release each 6 months. Back support: 2 distributions. Silverbullet: immutable desktop operating system.
- Etc.
Note
Implementation Grade: Easy (depending on your threat model). Be aware of the differences between a rolling release distro or a stable relaseone.
(Kernel) Choosing the right release
Depending on the linux distribution you choose, you’ll probably have different kernels available to choose from your package manager (see the arch linux ones, nixos, gentoo (where you’re compiling it), etc.
- Be aware which modules are available by default.
- Be aware which version are you using, if you’re using backported patches (LTS), etc.
Note
Implementation Grade: Medium. Can be hard to change the original kernel from your linux distro.
(Kernel) Choosing the right Linux Kernel configuration
- You can recompile your kernel, removing all the features that you don’t need, (removing filesystems support, drivers, etc, etc.)
- There are projects (like the grsecurity kernel patches or nix mineral for nixos that try to harden parts of the kernel, removing niche features, etc.
Note
Implementation Grade: Hard. You’ve a lot of time if you do that on your own server… But big companies usually do this.
(Kernel) Enable some Linux Security Modules (LSM’s)
The Linux Security Module (LSM) framework provides a mechanism for various security checks to be hooked by new kernel extensions.
— Linux Kernel Documentation, Linux Security Module (LSM)
In practice, this means that the LSM kernel modules can extend the security model with additional security features and enforcement mechanisms. These modules enable a wide range of capabilities, but in this section we will focus specifically on Mandatory Access Control (MAC) modules and modules used for resource and system-call restriction.
Before LSM’s, brief reminder of how users and permission works on linux
Let’s go to amsa.lol for a brief reminder of linux permissions.
Note
Okey, right now amsa.lol is dead :( the new domain name is called lleida.amsa.udl.cat
(Kernel) Mandatory Access Control subsystems (1/3)
Mandatory access control (MAC) is a type of security policy that differs significantly from the discretionary access control (DAC) used by default in Arch and most Linux distributions. MAC essentially means that every action a program could perform that affects the system in any way is checked against a security ruleset. This ruleset, in contrast to DAC methods, cannot be modified by users. Using virtually any mandatory access control system will significantly improve the security of your computer, although there are differences in how it can be implemented. — Arch Linux Wiki, SELinux
Note
Fun fact: Android relies heavily on SELinux to enforce security boundaries and access-control policies.
(Kernel) SeLinux policies (2/3)
On most systems, the policy files are stored in /usr/share/selinux/mcs. A SELinux policy usually looks like (example with chronyd, NTP client):
Usually, the policies look like:
Note
SELinux can be difficult to understand and configure. However, if you’re using a Red Hat–based distribution, it’s probably enabled by default. I recommend reading the Gentoo SELinux documentation for a good overview.
(Kernel) Mandatory Access Control subsystems (3/3)
SELinux/Apparmor are not magic, it just saves context of the domain inside the “metadata” of the file, and then uses the rules to analyze if we can do the action we want with it.
Note
It is only supported on filesystems that have the extended attributes support (this means, that on a file, we can add “metadata” attributes, LSM’s use this). You can see if your filesystem supports it via:
$ touch file.txt
$ setfattr --name=user.checksum --value="3baf9ebce4c664ca8d9e5f6314fb47fb" file.txt
$ getfattr file.txt
# file: file.txt
user.checksum
Note
Implementation Grade: Easy to enable but a pain to get “non-trivial-things” working.
(Kernel) Other subsystems for security (Landlock, etc)
Landlock is a Linux API that lets applications explicitly declare which resources they are allowed to access. Its philosophy is similar to OpenBSD’s unveil() and (less so) pledge(): programs can make a contract with the kernel stating, “I only need these files or resources — deny me everything else if I’m compromised.” — prizrak.me blog, Landlock-ing Linux
Note
Implementation Grade: Easy to enable but Hard to use (since you’ve to adapt userspace applications to use the LSM SDK).
(Kernel) Disable uneeded protocols or modules
The kernel allows unprivileged users to indirectly cause certain modules to be loaded via module auto-loading. This allows an attacker to auto-load a vulnerable module which is then exploited. Specific kernel modules can be blacklisted by inserting files into /etc/modprobe.d with instructions on which kernel modules to blacklist.
Note
Implementation Grade: Easy (if you know which protocols / modules aren’t really needed).
(Kernel / Userspace) Restrict access to sysfs, procfs, etc.
/procis a pseudo-filesystem that contains information about all processes currently running on the system. By default, this is accessible to all users, which can allow an attacker to spy on other processes. To permit users to only see their own processes and not those of other users, you must mount /proc with the hidepid=2,gid=proc mount options (change it on fstab).sysfsis a pseudo-filesystem which provides large quantities of kernel and hw information. sysfs has been the cause of numerous information leaks, particularly of kernel pointers. Whonix’s security-misc package includes the hide-hardware-info script, which restricts access to this directory as well as a few in /proc in an attempt to hide potential hardware identifiers and prevent kernel pointer leaks. This script is configurable and allows whitelisting specific applications based on groups.
Note
Implementation Grade: Very Hard (not trivial to create systemd services with this, a lot of programs really use procfs and sysfs…
(Userspace) Use hardened systemd services.
Systemd can sandbox services so they can only access what they need. Here is an example of a sandboxed systemd service:
[Service]
CapabilityBoundingSet=CAP_NET_BIND_SERVICE
ProtectSystem=strict
ProtectHome=true
ProtectKernelTunables=true
ProtectKernelModules=true
ProtectKernelLogs=true
ProtectHostname=true
ProtectClock=true
ProtectProc=invisible
MemoryDenyWriteExecute=true
NoNewPrivileges=true
RestrictSUIDSGID=true
SystemCallFilter=write read openat close brk fstat lseek mmap mprotect munmap rt_sigaction rt_sigprocmask ioctl nanosleep select access execve getuid arch_prctl set_tid_address set_robust_list prlimit64 pread64 getrandom
SystemCallArchitectures=native
IPAddressDeny=any
Note
Implementation Grade: Medium (requires some familiarity with systemd options, though LLMs can help with that nowadays).
(Userspace) Restricting root access
TODO
(Userspace) Restrict the SUID and SGID programs.
Usually, there are CVE’s related with SUID programs (see pkexec, sudo baron, sudo chroot privilege escalation, etc.
Try to avoid them, allways. Find them with (prepend a fourth leading digit (4 for SUID, 2 for SGID) to the standard three-digit permission mode):
Note
Implementation Grade: Easy, although your linux distro should already do this to you.
(Userspace) Don’t use sudo
You can use doas instead of sudo (which has had multiple vulnerabilities in the past, see all the CVE’s here…
It has too much features (even an insult one…), and the 99% of them are useless for the 99% of the users.
Note
Implementation Grade: Medium. Some programs expect sudo to be available, but adding a shell alias should do the trick, as long as they don’t rely on any of sudo’s more advanced features.
(Userspace) Restrict file permissions
Note
Implementation Grade: Easy
(Userspace) Restrict Capabilties
Note
Implementation Grade: Easy
(Userspace) Use PAM for add better security options
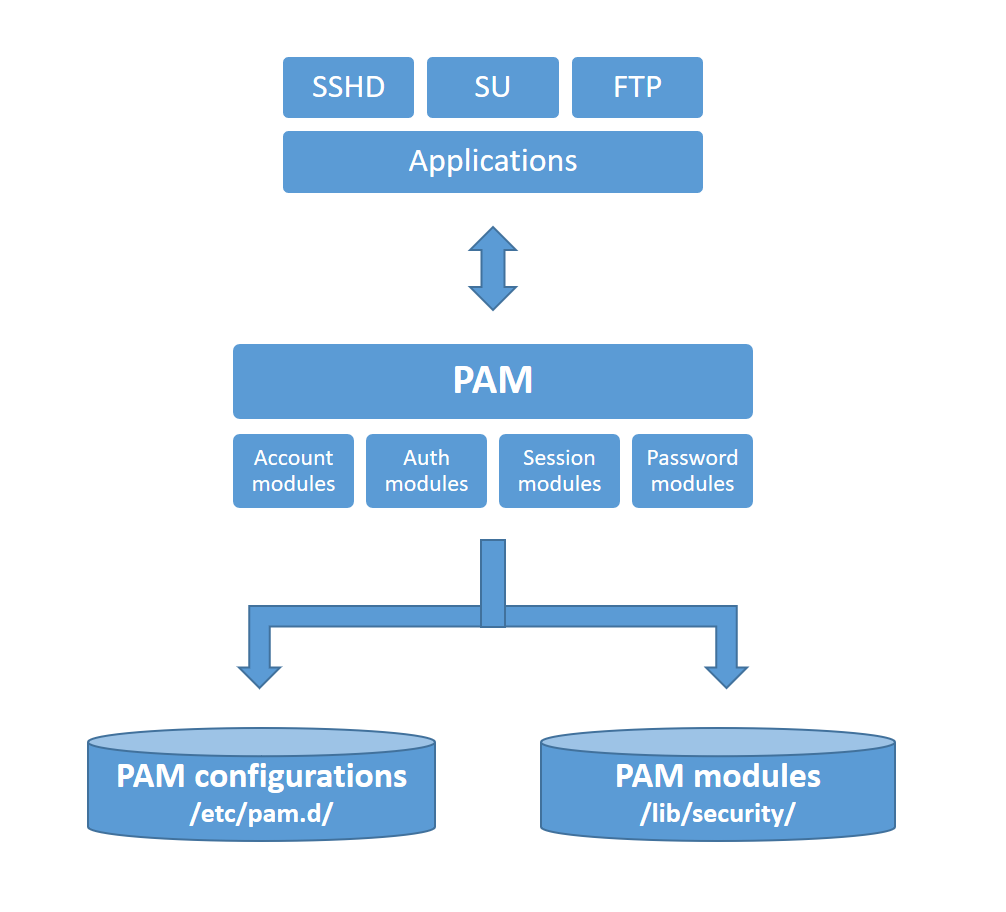
- You’ve a lot of PAM modules. You can even enable 2FA for the ssh daemon…
Note
Implementation Grade: Medium. Once configured, it works well, but getting there requires more than a simple “install and play” setup.
(Userspace) Add a networking firewall
- Block all transit by default, you can use iptables or nftables if you’re a pro, or if you are lazy (like me) use something like ufw (uncomplicated firewall)
Note
Implementation Grade: Easy.
(Userspace) Expose less ports/services
- Check which programs and services are listening on network ports on your computer using tools such as
ss,netstat, orlsof. - Disable or remove any listeners you do not need.
- In general, the fewer exposed services, the smaller your attack surface.
Note
Implementation Grade: Easy
(Userspace) Expose ports only via port-knocking.
Port knocking is a stealth method to externally open ports that, by default, the firewall keeps closed. It works by requiring connection attempts to a series of predefined closed ports. With a simple port knocking method, when the correct sequence of port “knocks” (connection attempts) is received, the firewall opens certain port(s) to allow a connection.
You can see how to enable it and more information about it here.
Be aware that it can infere with your firewall.
Note
Implementation Grade: Hard. It can also be a pain to use in practice. For example, before connecting via SSH, you first need to knock on the required ports in the correct sequence, and only then can you attempt to connect to the machine.
(Userspace) Fail2Ban if you’ve a public server.
- If you’ve a public server, you’ll have a lot of bruteforce attacks on it.
- Install fail2ban for banning ip’s that fail 3 logins in a row.
Note
Implementation Grade: Medium (you’ve to configure the jails for each service you want to have fail2ban enabled. see a video here
(Physical Security) Encrypt and verify everything.
Physical access changes the threat model.
- Full-disk encryption protects disk contents when powered off (if you use a server, you can encrypt it with the TPM)
/boot, firmware, and bootloader configuration still need integrity controls. (put a password on your bootloader, bios, etc).- Verified boot protects the boot chain and helps prevent persistence. (use secure-boot).
- USB’s are physical attack surfaces (ruberducky, picoducky, etc). You can even disable them.
(Physical Security) Use hardware keys, or TPM’s
More things to do (in your operating system, and in your own accounts)
This section was heavily inspired by the madaidans blogpost. It’s a great read, as is his blog post explaining why he considers Linux insecure, although we disagree on some of the points he makes.
You can even do more things on your own email accounts, phone, etc. see this youtube video by wolfgang’s that talks about it
Monitoring
Monitoring Stack
The monitoring stack has three main applications:
- Loki: Saves logs about your apps/services, etc.
- Prometheus: Collects metrics from apps and servers by pulling data over HTTP, stores it in a time-series database, and lets users run queries.
- Grafana: Used to create interactive visual dashboards, graphs, and charts (and alerts too!).
%%| echo: false
flowchart LR
  hosts[Linux hosts and services]
  apps[Applications]
  prom[Prometheus]
  loki[Loki]
  grafana[Grafana]
  alerts[Grafana alert rules]
  discord[Discord notification channel]

  hosts -->|metrics| prom
  apps -->|logs| loki
  prom --> grafana
  loki --> grafana
  grafana --> alerts
  alerts --> discord
What We Monitor
- Application logs.
- System state.
- Network traffic.
The monitoring stack makes those signals visible before and during an incident.
Prometheus
Is the metrics side of the stack.
- It collects numeric time-series data from systems and services.
- It lets us ask questions about state over time.
- It feeds Grafana dashboards and alert rules.
Examples of metric-style questions:
- Is disk usage growing?
- Is CPU load unusual?
- Did service availability change?
Loki
Is the log side of the stack.
- It stores log streams from systems and applications.
- It lets us query what happened around an event.
- It complements metrics: logs explain details that counters cannot.
Example log questions:
- Which service emitted this error?
- Which authentication events happened around this alert?
- Did the same pattern appear on other hosts?
Grafana
Is the UI for monitoring.
- Dashboards combine Prometheus metrics and Loki logs.
- Alert rules evaluate conditions continuously.
- Notifications send alerts to an operational channel, such as Discord.
Demo time!
TODO: Add a github repo with an example for using it, configuring it, etc.
Note
Be aware that this kind of deployment it’s hard to mantain and setup. It’s usually usefull when you’ve a lot of machines.
You can see this FOSDEM video talking about their big infrastructure, and how grafana/loki/prometheus make sense there.
IDS
IDS And IPS
An IDS is an Intrusion Detection System:
- It monitors a network or host.
- It detects anomalous activity with likely malicious intent.
- It informs the user and logs the event.
An IPS is an Intrusion Prevention System:
- It monitors like an IDS.
- It also acts to stop the event from taking place.
Many devices combine IDS, IPS, and firewall features.
Note
It is different from the architecture showed before (grafana) in the sense that it’s just plug and play, it just works. no need to configure a lot of stuff. Also, it analyzes the content of network packages, etc.
IDS Monitoring Inputs
An IDS can combine several monitoring functions:
| Input | Legacy slide label |
|---|---|
| Application logs | Log monitors |
| System state | Integrity checkers |
| Behavior patterns | Armoring |
| Network traffic | Sniffers |
Locus Of Detection
| Model | How it works |
|---|---|
| Distributed | Installed on hosts, analyzes local information, detects problems, reports to a coordinator |
| Centralized | Hosts send information to a global coordinator, which analyzes the data and detects problems |
Types Of IDS
| Type | Where it looks | What it monitors |
|---|---|---|
| HIDS | Host | Local user activity, local program activity, system logs |
| NIDS | Network | Anomalous network activity, often using deep packet inspection |
Network IDS can also be host focused.
IDS Versus Firewall
| Firewall | IDS |
|---|---|
| Prevents intent | Reacts to intent |
| Static control point | Dynamic monitoring point |
| Door, lock, fence, gate | Alarm or motion detector |
| Stops traffic by policy | Raises evidence and alerts |
Detection Models
| Model | How it works | Strength | Weakness |
|---|---|---|---|
| Signature based | Compares activity to known bad signatures | Fast, low false positives | Polymorphic payloads, 0-days |
| Anomaly based | Learns normal behavior and alerts on deviation | Better fit for unknown attacks | High false positives, needs labeled data |
Anti-virus software is a signature-based HIDS example.
IDS Evaluation
Traditional IDS evaluation uses the same confusion matrix terms as machine learning:
| Term | Meaning |
|---|---|
| True Positive | A real attack is detected |
| True Negative | Good traffic is detected as good |
| False Positive | Regular traffic is tagged as an attack |
| False Negative | An attack is not detected |
TPR And FPR
- True positive rate:
TP / (TP + FN) TP + FNis the total number of attacks.- False positive rate:
FP / (FP + TN) FP + TNis the total size of good traffic.
Operationally:
- Missing attacks causes severe problems.
- Too many false alarms makes people ignore or disable the IDS.
False Alarm Base Rate
Suppose:
- 1% of traffic is attacks.
- 90% true positive rate.
- 10% false positive rate.
For 1000 events:
- 990 good events + 10 attacks.
- 9 attack alarms.
- 99 false alarms.
P(attack | alarm) = 9 / (9 + 99) = 8.3%
An alarm is false about 92% of the time in this example.
IDS Problems
- Tuning is difficult: “OK, but not too much.”
- Anomaly detectors can be trained by an attacker over time.
- Alert behavior itself can be used to deny service.
- Attackers can create many alarms to hide a real attack.
Defeating IDS
Techniques from the legacy slides:
- Fragmentation: split packets artificially.
- Spoofing: alter TCP sequences.
- DoS: raise many alarms.
- Detector training: generate attack-like behavior gradually over long periods.
Where To Place IDS
IDS work is heavier than firewall work, and it needs access to useful traffic.
Deployment options:
- Between firewall and network, or router and network.
- On mirrored switch ports.
- Multiple sniffers reporting to a central server.
Available IDS
| Tool | Notes from legacy slides |
|---|---|
| Snort | Signature based IDS, can act as IPS, large community |
| Suricata | Signature based IDS, can act as IPS, modern architecture |
| Security Onion | Linux distribution with IDS and analytics tools |
Snort In This Course
We only need the operational view:
- Packet sniffer mode:
-v - Packet logger mode:
-l - Network intrusion detector mode:
-c
Important paths:
/etc/snort//etc/snort/snort.conf/etc/snort/rules//var/log/snort
TODO: Put video: https://www.youtube.com/watch?v=z1hX2PT3Cac
Honeypots
Honeypot
A honeypot is a trap set to detect, deflect, or counteract malicious attempts.
Its value comes from being used wrongly:
- A normal user should not need it.
- A malicious actor may interact with it.
- That interaction becomes signal.
Why Honeypots Exist
Honeypots can be used:
- As research tools to gather knowledge about techniques, tools, intents, and targets.
- As IDS-like early warning systems.
- As deflection tools that offer easier-looking targets.
Honeypot Goals
A useful honeypot:
- Is connected to a real or virtual network.
- Looks realistic.
- Looks attractive to attackers.
- Is actively monitored.
- Is prevented from becoming a pivot point.
Honeypot Taxonomy
Honeypots can be classified by:
- Interaction level: high or low.
- Implementation: physical or virtual.
- Orientation: production or research.
Interaction Level
| Low interaction | High interaction |
|---|---|
| Emulates only services or operating-system behavior | Exposes real services and operating systems |
| Cannot usually be fully exploited | Can be fully compromised |
| Easier to constrain | More realistic and more risky |
| Attack data is limited to the emulated level | Attackers may use it for further penetration attempts |
Physical Versus Virtual
| Physical honeypot | Virtual honeypot |
|---|---|
| Real machine deployed as the honeypot | Simulated by another machine |
| Own IP addresses and services | Many honeypots can run on one server |
| Usually high interaction | “Virtual” does not necessarily mean VirtualBox |
Production Versus Research
| Production | Research |
|---|---|
| Deployed in a real production network | Usually high interaction and complex |
| Usually low interaction | Used to discover methods, tools, tactics, and motives |
| Deflection or early warning | Forensics and analytics, not deflection |
| Should be easy to deploy and pull offline | Captures extensive data |
Honeypot Pros
- Small datasets.
- High-value data.
- Easier analysis.
- Can capture unseen tools and techniques.
- Relatively cheap.
- Works inside complex secure networks.
- Conceptually simple.
Honeypot Cons
- Only directed attacks are captured.
- Exposing a machine is risky.
- High-interaction honeypots take time to maintain.
- Understanding what happened can still be difficult.
- Low-interaction honeypots can sometimes be detected.
Legal Caveat
The legacy slides note legal uncertainty:
- Honeypots lure attackers by presenting a target.
- That can complicate legal action based on honeypot abuse.
For course purposes, treat honeypots as monitored defensive and research systems, not as legal traps.
Honeynets
A honeynet is a network of cooperating honeypots.
- Often includes a special firewall, such as a honeywall, monitoring all traffic.
- Based on the principle that no normal traffic should go to the honeypots.
- Useful for gathering information.
- Not primarily used for deflection.
Client Honeypots
Client honeypots reverse the usual model:
- They act as clients to Internet services.
- Web browsers are a common example.
- They detect attacks from compromised or malicious servers.
- They are useful for detecting new exploits and malware.
HoneyMonkey
HoneyMonkey was a Microsoft research project using reversed honeypots.
- A network of computers simulated web users.
- Browsers visited websites.
- The system compared memory before and after visiting a site.
- The goal was detecting malware injection and 0-day attacks.
Honeypot Tools And Resources
| Resource | Use |
|---|---|
| Honeyd | Monitors unused IP access, takes over the IP, creates a virtual honeypot |
| Project Honeypot | Crowdsourced effort to identify spam generators |
| Low-cost deployments | SBC-based honeypots or honeynets |
| Awesome honeypots | Curated list of honeypot tools |
Links:
App hardening
Dependabot And Alternatives
Repositories age after every commit:
- Dependencies receive security fixes.
- Transitive dependencies change under our code.
- A repository without update monitoring silently drifts.
Dependabot or a similar service makes dependency drift visible in GitHub repositories.
Why Automate Dependency Updates
Manual dependency review does not scale well.
| Without automation | With Dependabot or similar |
|---|---|
| Vulnerable versions may stay unnoticed | Pull requests or alerts make updates visible |
| Teams rely on memory | The repository records pending maintenance |
| Security updates compete with feature work | Dependency work becomes part of normal review |
Same Idea In Cloud Architectures
The same defensive pattern applies to AWS, GCloud, or similar architectures:
- Inventory what exists.
- Detect vulnerable, outdated, or exposed components.
- Alert the team.
- Apply a controlled update or configuration change.
- Keep evidence of the change.
The tool names change; the Blue Team loop stays the same.
Docker Images
- Be aware that the image that you use is trully the best.
- Make it smaller, less dependencies, less bloat.
Infrastructure as Code (IaC) and cloud architecture checks:
See: Kics: https://www.youtube.com/watch?v=oozrW1tiV8w
Forensic
File Carving
Deleting a file usually removes filesystem metadata before it destroys every byte of file content.
File carving tries to recover useful data from the underlying storage bytes after the filesystem no longer shows the file normally.
Important idea:
- The filesystem view and the raw storage view are not the same thing.
Deleted File Demo: Workflow
The source asks for this demo sequence:
- Format a USB with ext4.
- Mount the USB.
- Create a file inside the USB.
- Run
sync. - Remove the file.
- Remove the USB.
- Mount it again.
- Recover the file.
Deleted File Demo: Setup
Use placeholders. Confirm the device with lsblk before running destructive commands.
Warning
mkfs.ext4 destroys the filesystem on the selected device. Never run it until the target is confirmed.
Deleted File Demo: Create And Delete
At this point the directory entry is gone, but the raw device may still contain the marker.
Deleted File Demo: Recover Bytes
- sleuthkit
- scalpel / foremost
This is a minimal carving demonstration: search the raw device for content that the filesystem no longer lists.
Shred
shred overwrites file contents before removing the file.
Why it is useful:
- Normal deletion can leave recoverable bytes.
- Overwriting the file reduces the chance that file carving finds the old content.
Shred Demo: Same Setup, Different Removal
Shred Demo: Check Raw Bytes
The point of the demo is the contrast with normal deletion: after overwrite, the simple raw-byte search should no longer find the marker.
Imaging
A Linux operating system is files on disk.
If we copy the contents of a disk to another disk or image file, we can analyze it later:
- Preserve the state at a point in time.
- Avoid modifying the original while investigating.
- Run forensic analysis on the copy.
Don’t want imaging if your laptop/server is stolen?
Encrypt it with LUKS. Be aware that then you must be able to type the password to enter. Or, if not, use a TPM.
SIEM For Linux?
The source leaves this as an open question.
Use it to connect the course blocks:
- Monitoring collects metrics and logs.
- IDS produces alerts.
- Honeypots produce high-signal events.
- Forensics explains what happened after the fact.
A SIEM is the natural place to ask how these signals could be correlated, but product-specific detail is outside the current source.
A lot more
References
Course References
- Linux hardening guide: https://madaidans-insecurities.github.io/guides/linux-hardening.html
- Linux security caveat: https://madaidans-insecurities.github.io/linux.html
- Legacy IDS slides:
src/resources/past_courses/slides/ids-trans.pdf - Legacy honeypot slides:
src/resources/past_courses/slides/honeypots-trans.pdf - The opbible: http://opbible7nans45sg33cbyeiwqmlp5fu7lklu6jd6f3mivrjeqadco5yd.onion/opsec/opsec-mistakes/index.html?h=threat

Cybersecurity - 🏠 Home